Oxygen Saturation and Pulse Rate.
The graph below (left) shows the development of heart rate (pulse) and
oxygen saturation as a function of time and elevation. The units on the (horizontal) X-axis are days.
The upper curves are heart rate (pulse) per six second interval, while the lower curves are oxygen saturation/pulse.
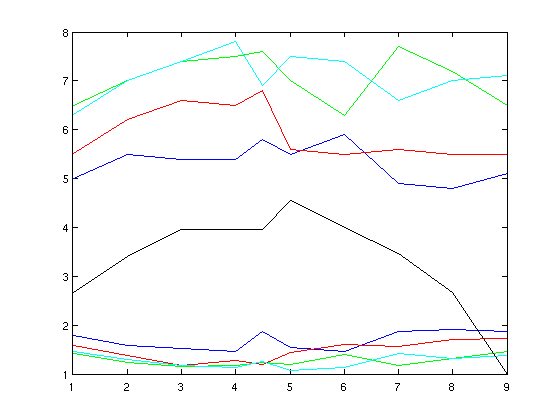
Legend:
BLACK: Elevation in thousand meter on the given days.
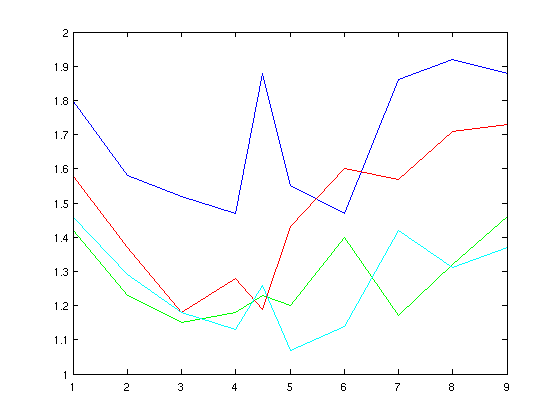
This figure shows the lower curves from the previous plot in more detail.
BLUE: Petter, age 59.
GREEN: Tor Erling, age 27.
RED: Rob, age 49.
CYAN: Pål Jørgen, age 20.
All measurements (except one early evening on day 4) are taken in the morning before getting up.
A normal saturation/pulse quotient would be near 2, for example an oxygen saturation of 98 and rest heart
rate (pulse) of 49. A ratio less than one is a clear sign of acclimatization trouble, an example would
be a saturation of 75 and a heart beat of 85.
One can observe (left plot) that the heart rate (pulse) decreases with age,
this seems to be valid at all elevations.
Only Rob (red curve) showed signs of AMS, these symptons were present on day 3 and 4, one sees a marked
improvement (right plot) after this period.
Return to Petter's mountain page