Oxygen Saturation and Pulse Rate.
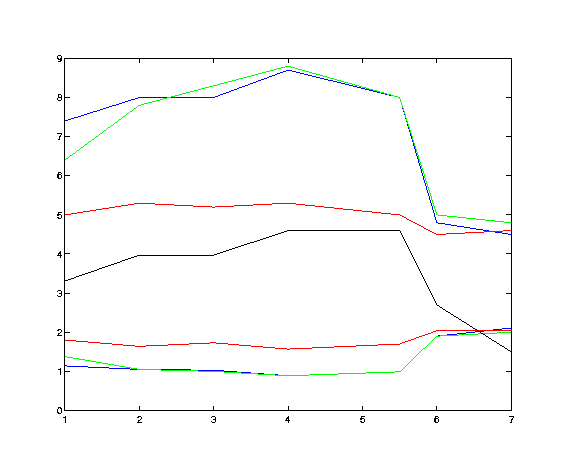
The graph below (left) shows the development of heart rate (pulse) and
oxygen saturation as a function of time and elevation. The units on the (horizontal) X-axis are days.
The upper curves are heart rate (pulse) per six second interval, while the lower curves are oxygen saturation/pulse.


Legend:
BLACK: Elevation in thousand meter on the given days.
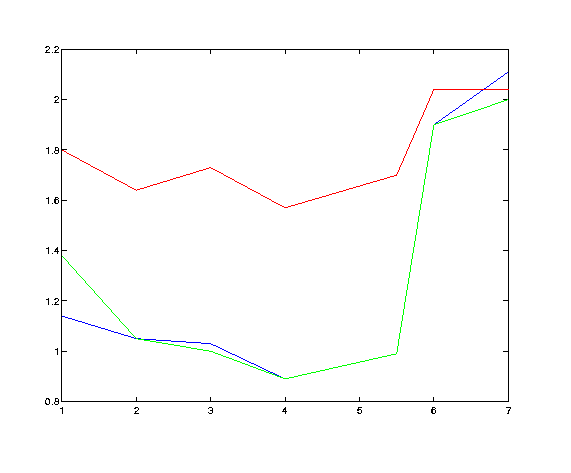
This figure shows the lower curves from the previous plot in more detail.
RED: Petter, age 57.
GREEN: Åke, age 33.
BLUE: Helge, age 43.
This plot starts with data from the first morning in Camp I, already above
3300 meter. It is a reasonable assumption that the curves would look similar to
the last day if we had recorded data in Merida, one day earlier.
One observes that Helge and Åke have a close correlation, with Helge
being slightly worse at the very beginning, but finishing with a very slight edge.
Petter is consistently less affected by altitude than the two others.
The plots show that Helge and Åke would need additional time at
the 4000 meter
elevation level before going to any higher (camp) elevation. (This was not
an issue on this trip, since our highest camp was "only" 4600 meter.)
All measurements are taken in the morning before getting up.
A normal saturation/pulse quotient would be near 2,
for example an oxygen saturation of 98 and rest heart
rate (pulse) of 49. A ratio less than one is a clear sign of
acclimatization trouble, an example would
be a saturation of 75 and a heart beat of 85.
Return to Petter's mountain page

