Oxygen Saturation and Pulse Rate.
The graph below (left) shows the development of heart rate (pulse) and
oxygen saturation as a function of time and elevation. The units on the (horizontal) X-axis are days.
The upper curves are heart rate (pulse) per six second interval, while the lower curves are oxygen saturation/pulse.
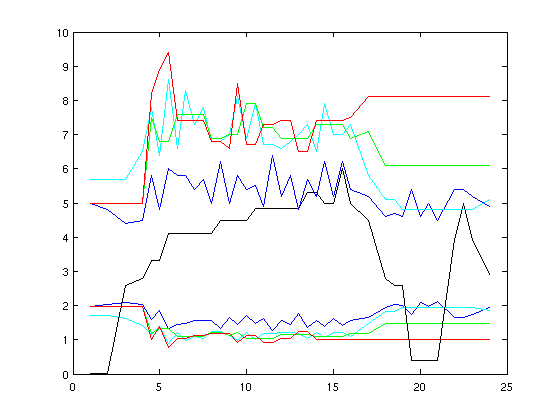
Legend:
BLACK: Elevation in thousand meter on the given days.
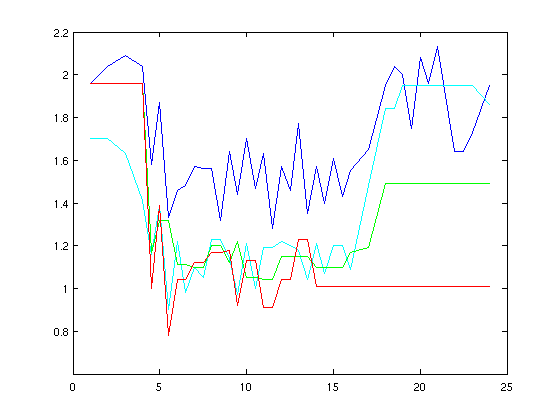
This figure shows the lower curves from the previous plot in more detail.
BLUE: Petter, age 58.
GREEN: Helge, age 43.
RED: Espen, age 35.
CYAN: Åke, age 35.
Espen (red curve) had clear signs of AMS in the period 5-11, this is fairly
well reflected by the curves.
There is overall good correlation between the team members as well as between the elevation, puls and
oxygen saturation levels. Espen started taking the drug Diamox from day 10, and continued with this
until day 17. His symptons of AMS (headache and lack of appetite) improved after day 10, however, one cannot
conclude (with certainty) that this was due to the taking of Diamox.
Note that a horizontal curve segment implies lack of data, that is the values have just been continued from the
previous measurement. Thus, horizontal curve segments should be discarded when reading the above
plots.
All team members performed well on day 15 when we reached the summit of Mount Logan.
Starting at day 22,
the team went on to climb
Mount Blackburn.
Petter seems consistently less affected by altitude than the rest of the
team.
All measurements are taken in the morning before getting up.
Often an additional measurement was
taken in the afternoon,
this would typically reflect a higher level of activity, almost always
giving a higher heart rate reading.
A normal saturation/pulse quotient would be near 2, for example an oxygen saturation of 98 and rest heart
rate (pulse) of 49. A ratio less than one is a clear sign of acclimatization trouble.
Return to Petter's mountain page