The graphs below show the development of heart rate (pulse) and
oxygen saturation as a function of time and elevation. Tor was
19 years old and Petter was 51 years old at the time of climb.
The four plots
show the following information:
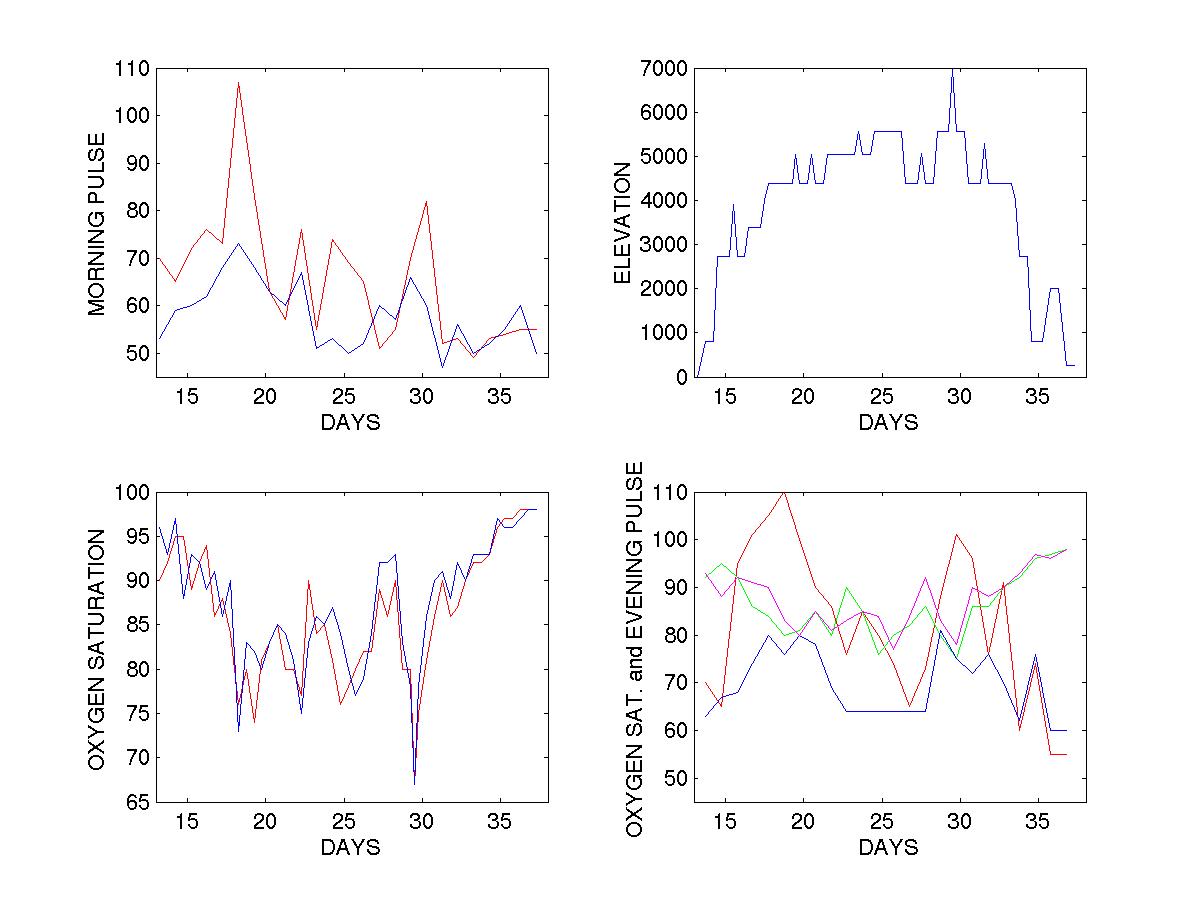
Plot 11 (upper left) shows Tor's morning pulse in red, Petter's
morning pulse in blue.
Plot 12 (upper right) shows the Elevation, the first peak is Banderitas
Norte, then two carries to Canada, followed by one carry to Nido de
Condores. The next peak is Cerro Bonete, then Cerro Aconcagua, followed
by Cerro Catedral. The very last "peak" is the flight home.
Plot 21 (lower left) shows the oxygen saturation measured every morning
and evening, plus one measurement mid-day at 6700 meter elevation. Red
is Tor, blue is Petter.
Plot 22 (lower right) shows Tor's pulse (red) and his oxygen saturation
(green) measured each evening before sleep. The corresponding data for
Petter is pulse (blue) and saturation (magneta).
Return to Petter's mountain page