The next graph shows heart rate as a function of time.
Again, the elevation graph is plotted together with three curves of the
heart rate.
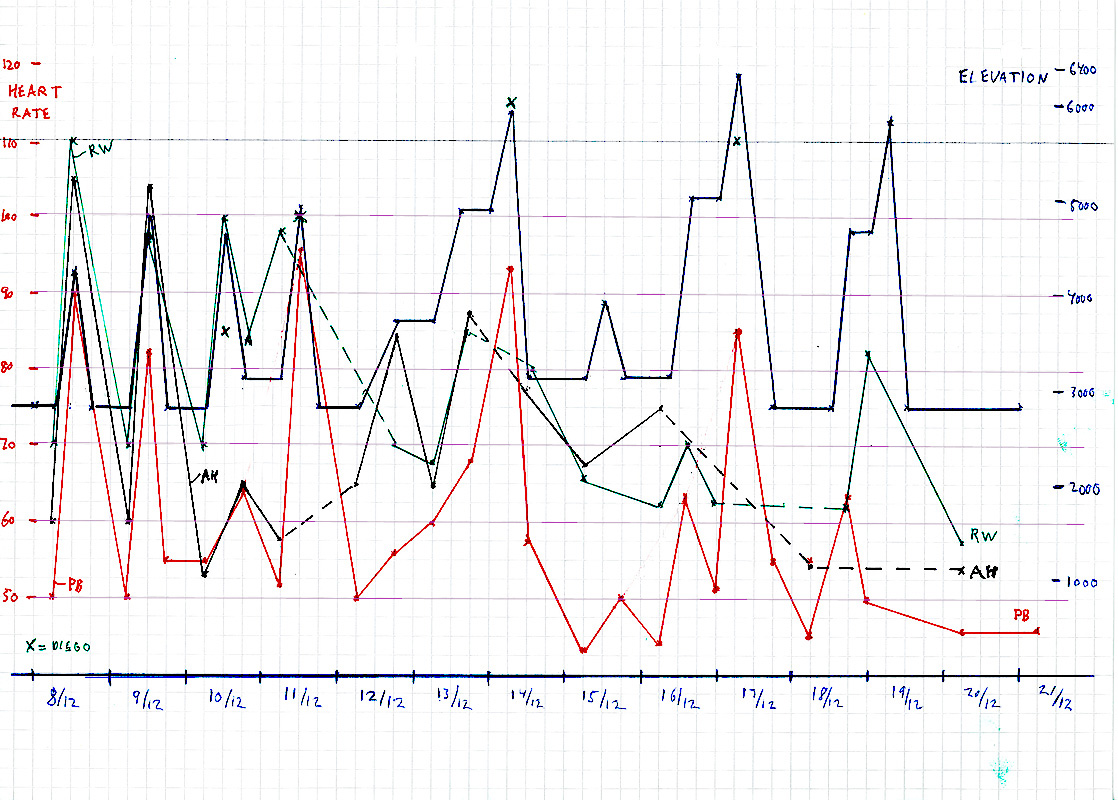
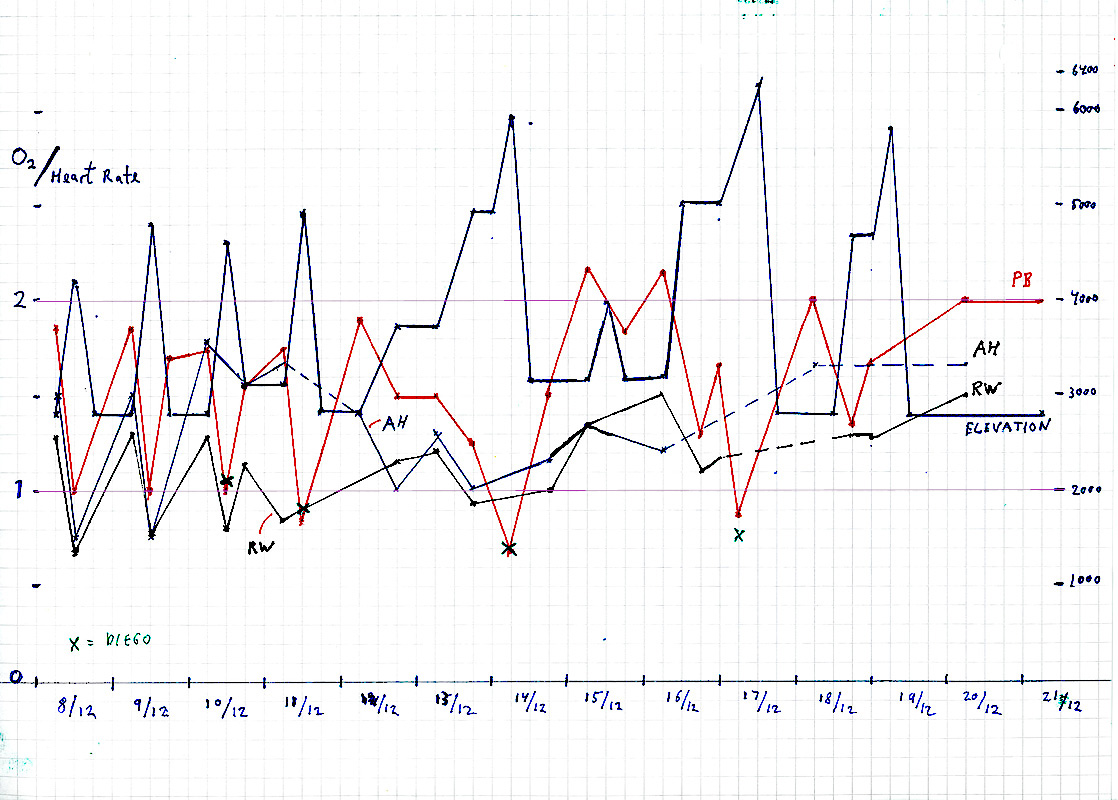
Legend:
Blue "spiky curve" (with horizontal sections) is the elevation visited as a function of time (days).
Green curve is Rob Woodall (age 48).
Black curve is Adam Helman (age 48).
Red curve is Petter Bjørstad (age 58).
The 4 green crosses represent summit values from our local Guide Diego Zurita (age 44).
Dashed lines represents a time interval with some missing measurements.
Again, we observe a strong correlation between elevation and heart rate. Perhaps more
interesting is the ability to (quickly) recover a low heart rate when returning to lower
altitude.
Morning and afternoon/evening measurements were typically taken while
laying down at rest. The summit measurements were generally taken while sitting
or standing.
On December 10-11, Rob shows a weaker condition, this correlates well with a period when
he was sick.
Overall, Rob measured a somewhat higher heart rate than the other two participants.
Both graphs above show that acclimatization has improved with time for all three team members.
Return to Petter's mountain page