Oxygen Saturation and Pulse Rate.
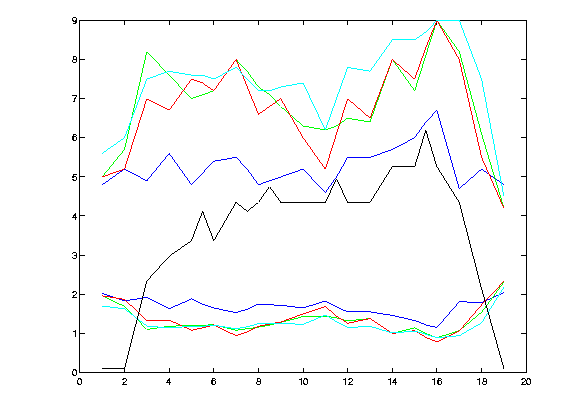
The graph below (left) shows the development of heart rate (pulse) and
oxygen saturation as a function of time and elevation. The units on the (horizontal) X-axis are days.
The upper curves are heart rate (pulse) per six second interval, while the lower curves are oxygen saturation/pulse.


Legend:
BLACK: Elevation in thousand meter on the given days.
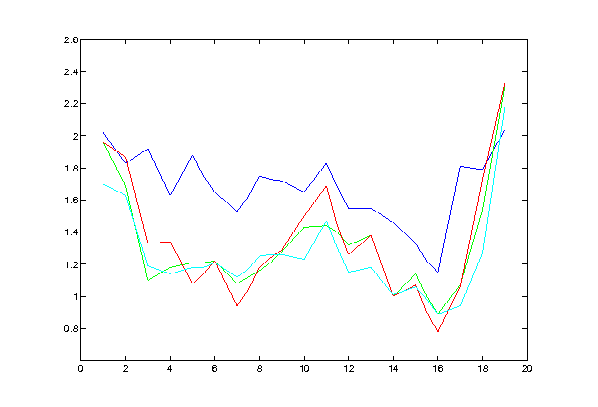
This figure shows the lower curves from the previous plot in more detail.
BLUE: Petter, age 55.
GREEN: Helge, age 41.
RED: Olav, age 36.
CYAN: Jan-Frode, age 31.
Olav (red curve) had clear signs of AMS in the period 5-8, this is fairly
well reflected by the curves.
Olav recorded a saturation of 70 with a morning (wake up) heart rate of 90 (giving a ratio of
about 0.8) the morning after our summit climb. This was the lowest number recorded. Note that there
is overall good correlation between the team members as well as between the elevation, puls and
oxygen saturation levels. The team shows an overall acclimatization in the period from day 8 to day
11, while in basin camp. We touched 5000 meter on day eleven, moved to high camp on day 13 and summited
on day 15.
Petter seems consistently less affected by altitude than the rest of the
team.
All measurements are taken in the morning before getting up.
A normal saturation/pulse quotient would be near 2, for example an oxygen saturation of 98 and rest heart
rate (pulse) of 49. A ratio less than one is a clear sign of acclimatization trouble, an example would
be a saturation of 75 and a heart beat of 85.
We are missing one data point for Helge at day 16 (the morning after summiting), similarly we have included
some mid-day elevations in the data, but only interpolated the corresponding saturation and heart rate
data points.
Return to Petter's mountain page

