 |
|||
The Graph viewers |
|
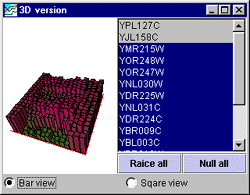
There are three ways to open a graph viewer. One is from the dendrogram in the main view, by clicking one of the small green squares. This method will display every gene in the subtree defined by the cluster marked by the square. The second way is to mark an area in the PCA-window. This will open a gene graph window with every gene, marked by a spot, which is inside the yellow square. The third way is to open a SOM-graph by sweeping genes in a SOM-window and clicking on a graph in the somframe. See the SOM section for details. FunctionalityThe colors on the left side indicated the value of the expression relative to the other values in the complete dataset. This is an important property to remember when studying the gene graph. The values on the y-axis display the actual expression values. The height of the graph does not. There is also two lines on the y-axis showing the max and min value. The blue graph displays the mean values of the selected dataset. Each horizontal line has an expression value written to the left, and each vertical line is a column in the dataset. The window can be resized to desired size any time.The menu3D This button will open a new window with the same genes displayed side by side in a 3-dimensional bar or squarediagram. The diagram can be rotated and zoomed by dragging the mouse in the left part of the window. At the bottom of the window, it is possible to select type of view. The list on the right can be used to raise one and one gene or to lower them. When a gene is set to null, that is it is not selected in the list, all its displayed values will be null. The two buttons can be used to lower or raise all at once. The 3D-version is a powerful tool to use when the amount of data to be studied is small. It is not well suited for large amount of genes and/or high dimensions. This is mainly because the visualization is too time-consuming. The idea is to use PCA, SOM or other fast methods to quickly group related data together, and then use this tool to "zoom in" on the interesting parts.
SOM When there are to many genes in the genegraph, it might be difficult to separate an interesting pattern from other genes or patterns. The SOM-button will launch the SOM subprogram on the set in the graph, and this way we can make further refinements.
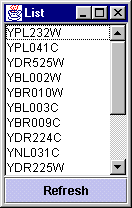
List This button will open a window with a list displaying each gene in the graph. When a gene in the list is selected (Marked blue), this gene will be colored yellow in the graph when clicking the Refresh button. If it is hard to define which gene is where in the graph, all genes but this one should be selected in the list, leaving this as the only one with expression color.
Save This will save the graph as a gif-image.
Profiler This button will open a profiler-window. This part of the program is not yet complete, so the help will come after the program is completed.
|
|


