Modeling the Skagerrak area in the period
1990-03-15 to 1990-06-26
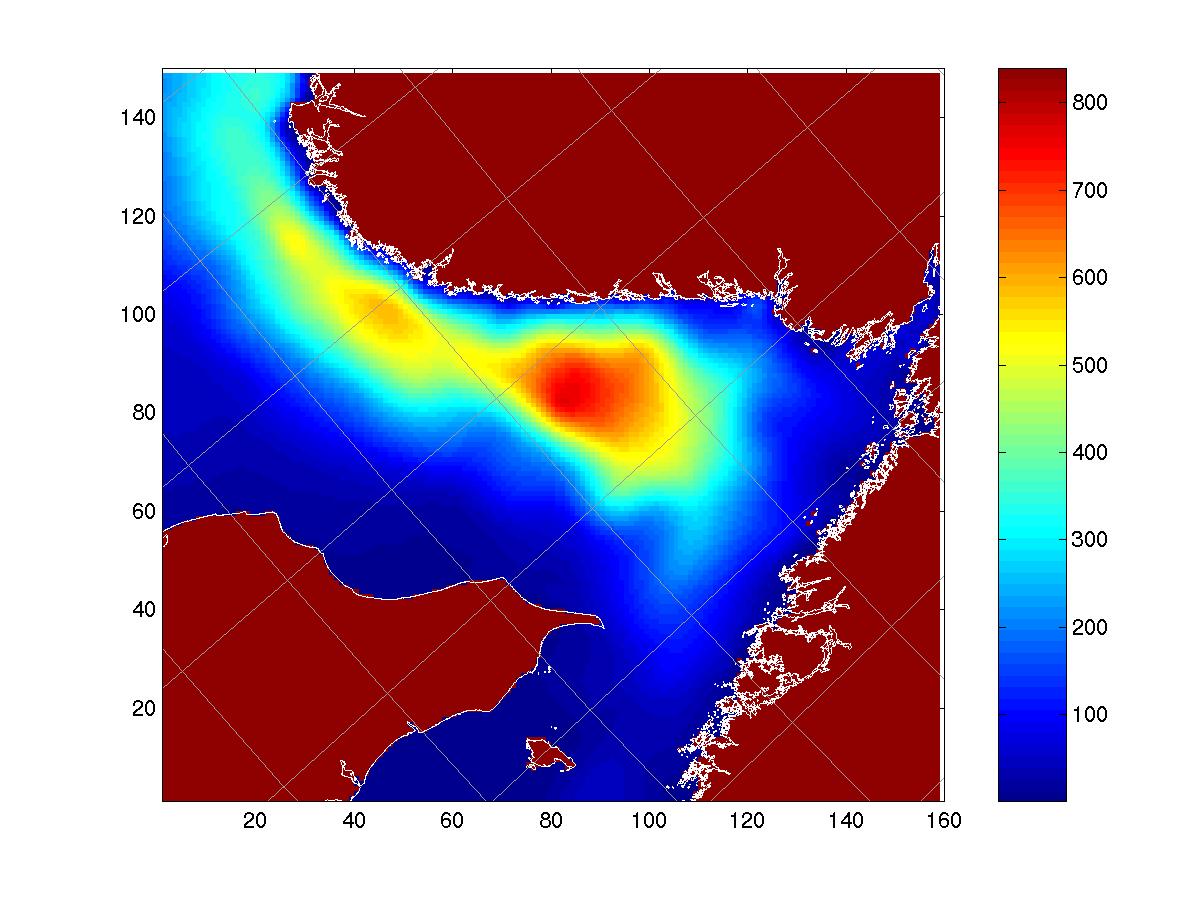
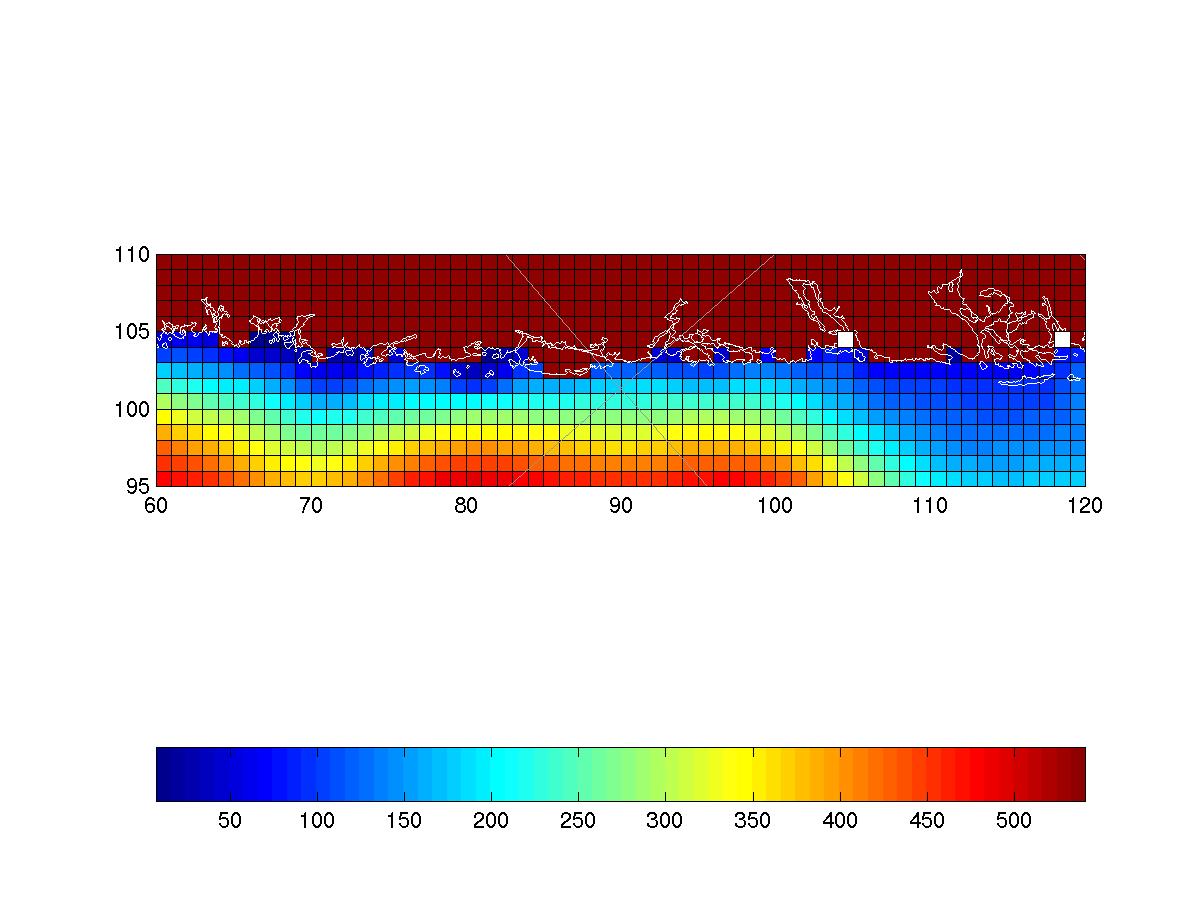
The Bergen Ocean Model BOM set up with 2km resolution, forced with winds from DNMI, rivers and boundary values from a 4km resolution model of the North Sea via a 13 cell wide FRS-zone.

Bathymetry
High resolution coastlines generated with Generic Mapping Tools(GMT)
The computational domain Detail from the South coast of Norway, rivers are marked with white boxes.

GIF animations from test runs - first few days.

Implicit time stepping, (CM=0.3)
Surface: Elevation | Salinity | Temperature| Velocity
10 meter depth: Salinity| Temperature | Velocity

50 meter depth: Salinity| Temperature | Velocity

ISO-surfaces for 1023.,| 1024.5,| 1026.,| 1027. - water

Salinity Section F

Helge Avlesen,
Department of Informatics, University of Bergen