
A few years ago I «fell in love» with Python , which is a dynamically typed interactive, object oriented scripting language. With a few extensions I found it very suitable for efficient visualization and problem solving in Scientific computing. So can it replace Matlab? For me its pretty close! For you? It depends on your needs, but have a look!

First of all install a 32-bit python 2.7.x or similar from python.org
The precompiled package with pygist and Numeric: num24.2pygist1.5.28.zip
To use it, unpack e.g. in "C:\"
Set the following environment variables: (go to Control panel, System and security, System, Advanced system settings, Environment variables, User variables)
name         value
PYTHONPATH   C:\num24.2pygist1.5.28\Lib\site-packages\Numeric;C:\num24.2pygist1.5.28\Lib\site-packages\gist
GISTPATH     C:\num24.2pygist1.5.28\g
If you are lucky, Pygist now works... The above zip also worked on 32bit Windows XP.
If you want to build your own library, follow the steps on a separate page
I converted each EPS to GIF using Ghostscript and Imagemagcick, something like calling this function for each screen from gist I wanted to dump:
import commands
def image(name, type='gif', resolution=300, size=600):
    gist.eps('dumpgif_tmpeps')
    command='convert -density '+`resolution`+'x'+`resolution`+\
             ' dumpgif_tmpeps.epsi -resize '+`size`+'x'+`size`+' '+name+'.'+type
    status,output = commands.getstatusoutput(command)
and then finally "gifsicle" was used to combine the GIF's into an animation.
Using convert implies antialiasing or ugly aliasing in the image files. X seems to render much more cleanly, and we can utilize this via a screen captures. My favorite for doing this is another tool from Imagemagcick called "import", which can capture a region of my screen to a file of the desired format. On my 1280x1024 monitor I open a 100dpi gist window
   ...
   gist.pldefault(dpi=100)
and place it in the upper right corner. The razor sharp plotting area can then be captured and saved in a GIF file by a simple call to the function defined as
def capture(name, type='gif', geometry='600x600+680+50'):
    command='import -window root -crop '+geometry+' '+name+'.'+type
    print 'Running: ',command
    status,output = commands.getstatusoutput(command)
You will most likely need to adjust the geometry parameter.
    gist.window(display="", hcp="dummy.ps")
    ...
    image("testimage", resolution=150)
    ...
    gist.winkill(0)
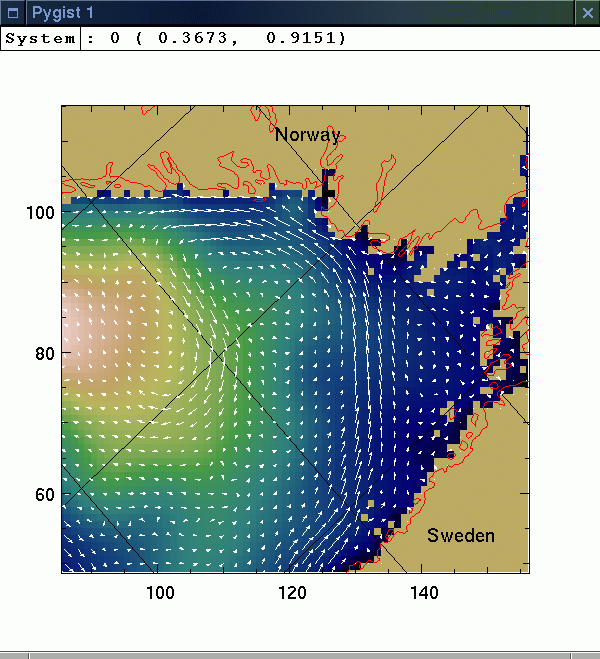
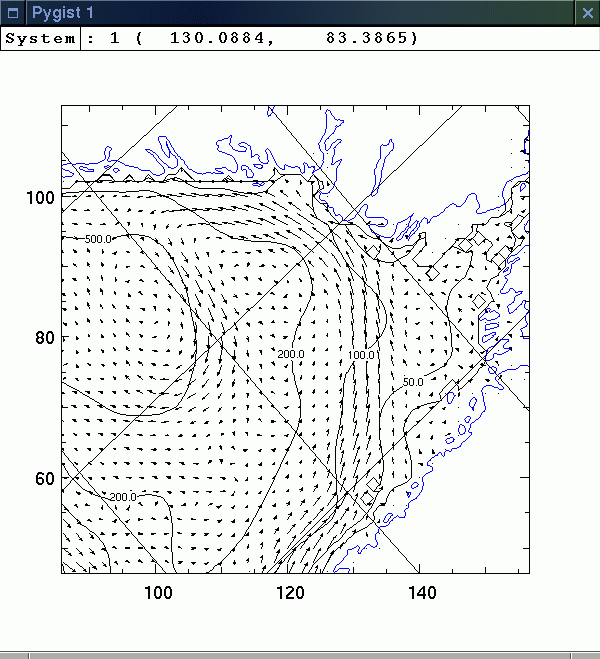
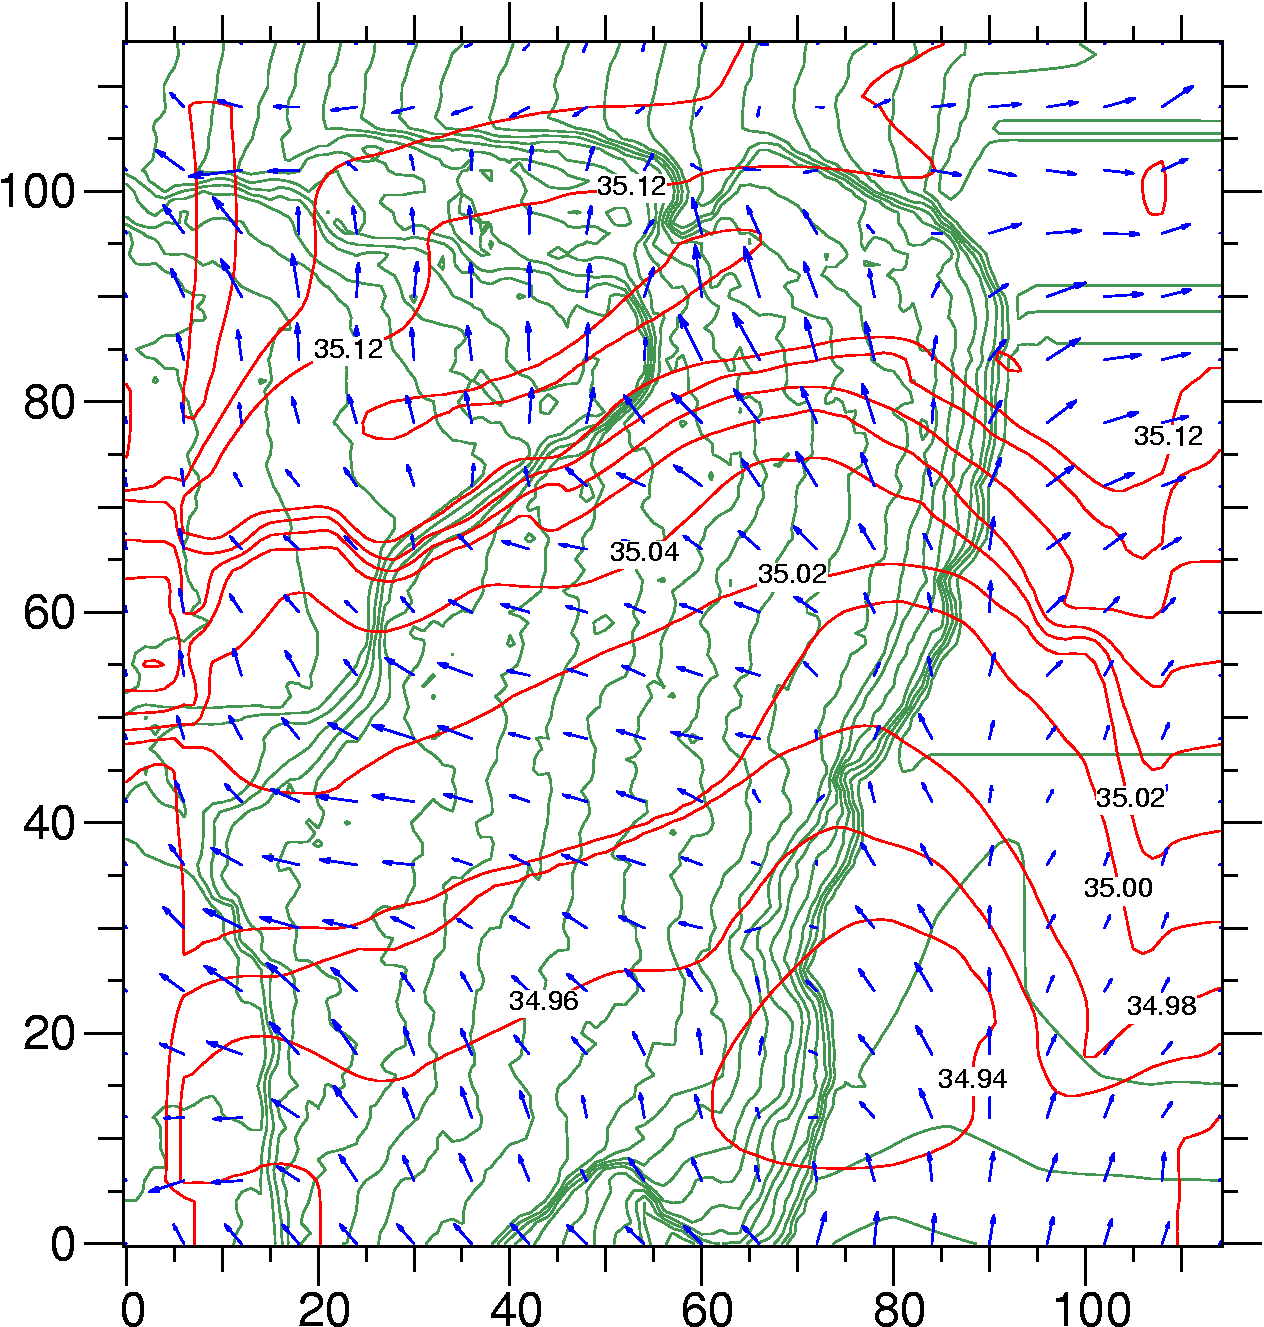
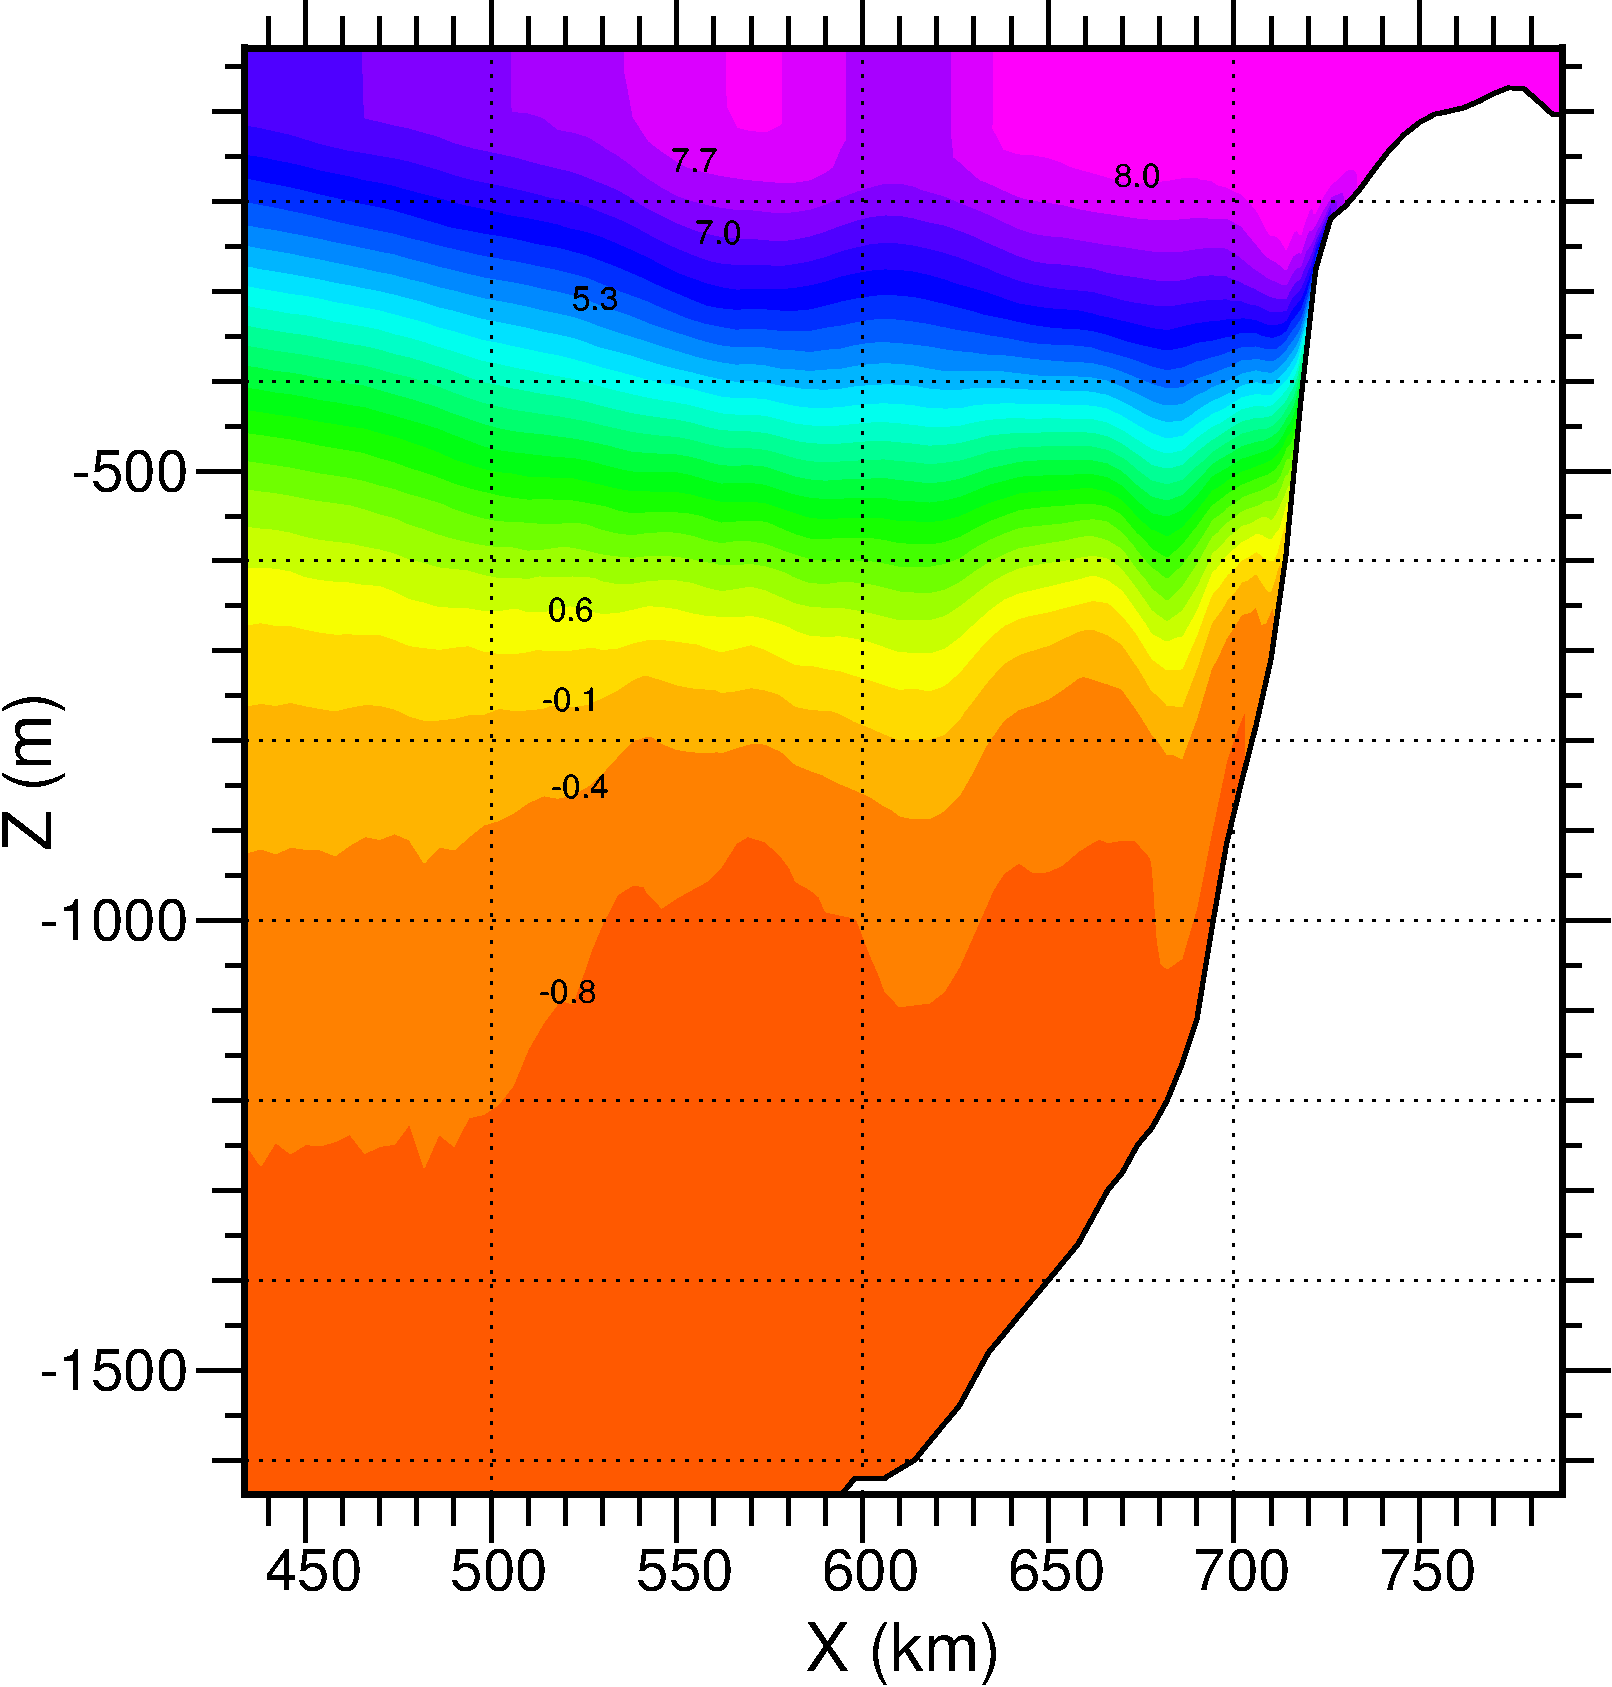
Pygist: Gist is a very fast graphics library for 2D and 3D plots written directly for X11, but also ported to Mac and Windows. Gist is a part of the Yorick language (PS dead link but provided for reference). Pygist contain the Python bindings, read about it here. A recent version of Pygist can (by Sep 2012 make that "could"...) be found here. Pygist is currently also a part of a distribution of Python packages called Scipy, that can be found here.
f2py: Makes connecting Fortran subroutines a breeze! Also a part of Scipy. A complete example: wrap this subroutine in a Python function returning "dist":
[avle@tindved test]$ cat r1.f90
subroutine r1(x,y,n,dist)
  real x(n),y(n)
!f2py intent(out) dist
  xl=0.0 ; yl=0.0 ; vp=0.0
  do i=1,n
     xl=xl + x(i)**2 ;  yl=yl + y(i)**2
     vp=vp + x(i)*y(i)
  end do
  if(vp>=0.0)then
    dist = acos(sqrt(vp/(xl*yl)))
  else
    dist = 4*atan(1.0)-acos(sqrt(-vp/(xl*yl)))
  end if
end subroutine r1

[avle@tindved test]$ ls
r1.f90
[avle@tindved test]$ f2py -c -m r1 --fcompiler=g95 r1.f90
..lots of output...
[avle@tindved test]$ ls
r1.f90  r1.so*
[avle@tindved test]$ python2
Python 2.2.3 (#1, Feb 15 2005, 02:41:06)
[GCC 3.2.3 20030502 (Red Hat Linux 3.2.3-49)] on linux2
Type "help", "copyright", "credits" or "license" for more information.
>>> import Numeric as nx, r1
>>> a=nx.array((2.3,2.2)) ; b=nx.array((3.2,2.1))
>>> r1.r1(a,b)
1.2827057838439941
>>>
Update 2012: f2py has been included in numpy for a long
time. If you download and install the 32 bit Windows installer, there
will be a script called f2py.py, for me located in
"\Python27\Scripts", that can be executed directly in DOS. With MinGW gfortran use the command
f2py.py -c -m r1 --fcompiler=gfortran r1.f90to build the example above.
from unix import *on the python prompt you now have the following commands available
ls runs "/bin/ls -F -s" lsd(dirname) runs "ls" ll runs ls -ltr cd(dirname) same as "cd dirname" cat(filename) same as "cat filename" less(filename) same as "less filename" emacs(filename]) invoke "emacs -nw filename" eog(imagefilename) acroread(pdffilename) gv(postscriptfile) pwd same as pwd rm(filename) rmdir(dirname)
Matplotlib. This is a rapidly developing package for plotting with python, and already is on par with Gist featurewise. It is maybe The package to watch for publication quality plotting in python, but still suffer from a few rough corners. Its quiver and pcolor routines are e.g. extremely slow for anything except toy datasets.
Scipy: an attempt to integrate several well known packages, e.g. Numeric python, spline algorithms from netlib, Lapack pieces, Gist, fft and more.
ScientificPython: utility stuff, e.g. netCDF support.
Paul Dubois has written a summary of some of LLNL's Python activities in climate modeling.