|
|

The Visual Computing Forum, or VCF, is a
series of seminars organized by the visualization
group with selected talks from the fields of
visualization, image processing, computer graphics,
and so on. The individual seminars are arranged
approximately once a month, on Fridays from 11am to
12am, and they will be interleaved with the MedViz seminars.
They will be held either at the H°yteknologisenteret
or at the VilVite
Science Center.
If you wish to be informed about upcomming VCF events, please write an e-mail to "vcf.bergen@gmail.com", "Helwig.Hauser@UIB.no" or "Sergej.Stoppel@UIB.no".
|
|
November 13th, 2015
Title: Topological methods for data analysis
Speaker: Morten Brun
Place: Room 3137, 3rd floor H°yteknologisenteret
Time: Friday November 13, 2015, from 10:15am to 11:00am
Abstract:
I will explain how we have used persistent homology to examine
meteorological data. In particular we have studied patterns of weather
fronts that have reached Bergen. This is an ongoing joint project
between the department of geophysics and the department of mathematics
here in Bergen. If time permits, at the end of the talk I will sketch
how we envision to use topological data analysis in the study of the
stress imposed on cod liver by pollution.
Additional material:
Flyer
|
|
|
October 16th, 2015
Title: Perceived visual quality assessment
Speaker: Junyong You
Place: Room 3137, 3rd floor H°yteknologisenteret
Time: Friday October 16, 2015, from 10:15am to 11:00am
Abstract:
Visual signals are often distorted due to unavoidable factors, e.g., lossy compression,
transmission over error prone networks. Accurate assessment of visual quality plays an
important role in multimedia services in order to provide the best viewing experience to
end-users. Traditionally used quality metrics, e.g., PSNR (peak signal-to-noise ratio)
often cannot accurately represent the actual distortions perceived by human users. For
example, the distorted images below all have same PSNR values with respect to the original
reference image, while they present different levels of perceived distortions. This talk
presents methodologies of perceived visual quality assessment, including visual mechanism
modelling and applications in objective visual quality metrics. A video quality metric
driven visual attention and foveation mechanism that was developed by the presenter will be
introduced as an example. Applications in other areas will also be briefly mentioned.
Additional material:
Flyer
|
|
|
September 18, 2015
Title: Visualizations for conveying biochemical properties across and along protein voids
Speaker: Jan Byska
Place: Room 3137, 3rd floor H°yteknologisenteret
Time: Friday September 18, 2015, from 10:15am to 11:00am
Abstract:
Proteins are highly complex systems contributing to all functions in living organisms.
Understanding their function helps to reveal the fundamentals of biochemical processes that are
taking place in living cells. This search process, however, consumes an enormous amount of time
and resources, due to the internal protein dynamics, which constantly change structural and
biochemical characteristics of the protein over time. Thus, several in-silico predictive methods
already appeared, which focus mostly on the analysis of the protein structure. In this talk we
will mainly focus on methods for interactive exploration of protein inner void space including
its geometry, physico chemical properties and dynamics to evaluate or modify the reactivity of
the protein with other small molecules.
Additional material:
Flyer
|
|
|
August 28, 2015
Title: Bridging Spatial and Temporal Scales in Biological Data Visualization
Speaker: Ivan Viola
Place: Room 3137, 3rd floor H°yteknologisenteret
Time: Friday August 28, 2015, from 10:15am to 11:00am
Abstract:
The study of biological processes carried out in living organisms is among the central foci of modern
science. The field is nowadays by large extent computational, there are many kinds of digital models
that characterize particular aspects of life. To provide a comprehensive view on biological phenomena,
visualization offers itself for integrating multiple models into one visual environment.
One of the interesting challenges, associated with such a visual integration, is to communicate
phenomena that are simultaneously described on several spatial and temporal scales. In my talk I will
discuss visualization techniques that bridge five orders of magnitude of spatial scale by interactively
displaying structural information from a single atom level up to entire bacteria cell size with complete
molecular machinery
When dealing with simulation of molecular interactions in living organisms, agent-based models are
used to model long sequences of Brownian motion that randomly carry out several physiologically
relevant events. One such event occurs on average every thousandth simulation iteration in the agent
based simulation. In order to perceive random motion but also to see relevant events simultaneously,
we bridge two temporal scales that are three orders of magnitude apart from each other. The approach
is based on a special timelapse approach inspired from scientific animation techniques.
In the last part of my talk I will present a technique for interactive 3D visualization of molecular reaction
pathways that is controlled in a top-down manner by quantitative simulation and is simultaneously covisualized.
In such visual environment the viewer can interactively control the visualization as well as
simulation parameters.
Additional material:
Flyer
|
|
|
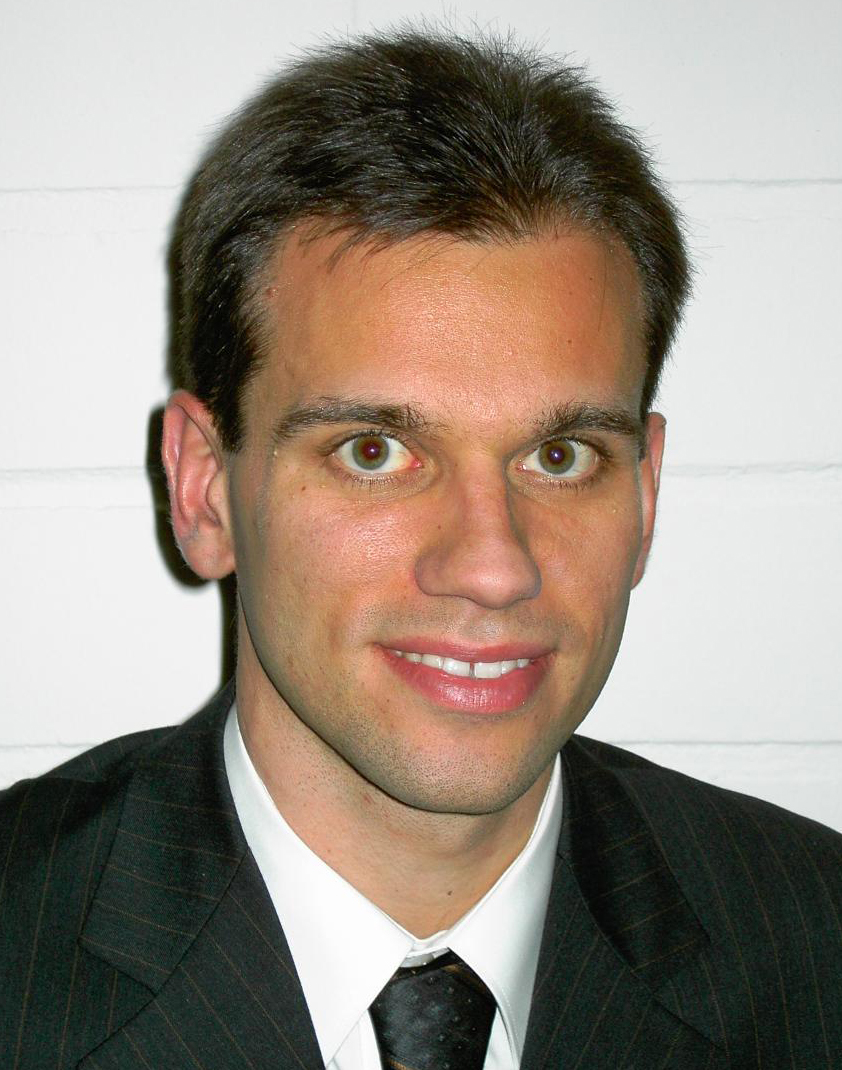
May 20, 2015
Title: Visual Analysis of Ensembe Simulations
Speaker: Prof. Dr.-Ing. Lars Linsen
Place: Big Auditorium, 2rd floor, H°yteknologisenteret (data blokk)
Time: Thursday May 20, 2015, from 14:00am to 15:30am
Abstract:
Mathematical models are used for the description and the understanding of phenomena
in all sciences. Numerical simulations support the validation of the models and data
assimilation purposes. Such simulations often depend on a number of simulation parameters
and initial configurations. The selection of these parameters and configurations is often
not exactly known or their impact is part of the underlying research tasks. Therefore, multiple
simulation runs with varying parameter settings or ensembles of simulations with varying configurations
are executed. The analysis of such simulation ensembles is complex, especially when each
simulation run represents a four-dimensional spatio-temporal phenomenon. The amount of
data of a simulation ensemble often adds up to hundreds of Gigabytes or even Terabytes.
The analysis of such complex data is no longer possible without the use of computers.
On the other hand, such an analysis typically requires the expertise of a human. As visual
representations are intuitive and can be processed efficiently by humans, it is a suitable
approach to combine visual representations and interaction mechanisms with automatic analysis
steps. In this talk, I will present novel visualization methods that allow for an interactive
comparative analysis of such large and complex data stemming from simulation ensembles.
The methods are applied for the analysis of data stemming from biology, climate research,
astrophysics, and medicine.
Additional material:
Flyer
|
|
|
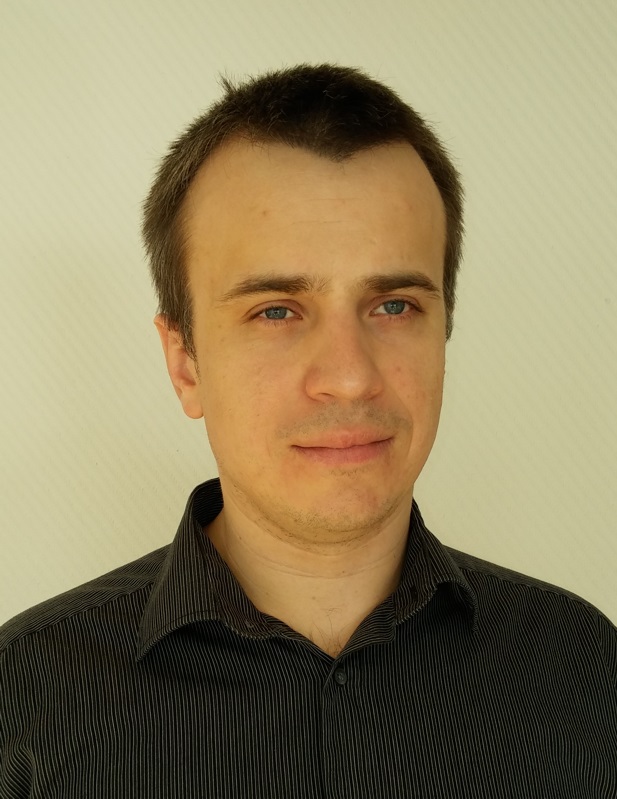
April 10, 2015
Title: Visual analysis for leakage detection in subsea acoustic monitoring.
Speaker: Julius Parulek (Adjunct associate professor at UIB)
Place: Room 3137, 3rd floor, H°yteknologisenteret (data blokk)
Time: Friday April 10, 2015, from 10.15am to 11.15am
Abstract:
In situ analysis of streamed acoustic data is crucial for sub sea environmental
monitoring tasks. One of the crucial applications is represented by detection
of oil and gas leakages from subsea installations. On the software level, the
monitoring system is based on semi-automatic and also on fully-automatic data
analysis pipeline, which incorporate challenges related to big data analysis,
visualization and machine learning. In this presentation, I will aim mainly at the
role of visualization and machine learning in the detection of gas plumes.
Additional material:
Flyer
|

|
|
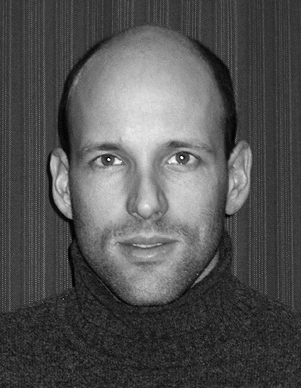
March 13, 2015
Title: CAVER - Analysis and Visualization of Protein Structure
Speaker: Barbora Kozlikova (Assistant Professor at Masaryk University in Brno)
Place: Room 3137, 3rd floor, H°yteknologisenteret (data blokk)
Time: Friday March 13, 2015, from 10.15am to 11.15am
Abstract:
The talk aims to present the background of the CAVER project which is dedicated to analysis
and visualization of proteins. Our algorithms are focusing namely on the detection and
classification of inner void space. This long-term project is baed on a tight cooperation with the
group of biochemists. In the talk I'll concentrate on the main principle and future challenges of this project.
Additional material:
Flyer
|
|
|
February 06, 2015
Title: Quantitative analysis of dynamic contrast enhanced MR (DCE-MRI) data of the kidney
Speaker: Erlend Hodneland (MedViz PostDoc at CMR.no)
Place: Room 3137, 3rd floor, H°yteknologisenteret (data blokk)
Time: Friday February 06, 2015, from 10.15am to 11.15am
Abstract:
Quantitative analysis of DCE-MRI data from the kidney has the potential to become a clinically
highly useful imaging modality for the non-invasive investigation of organ function. There are
major challenges related to perfusion imaging of the human kidney that I want to address. The
processing pipeline has several components: choice of MR sequence, breathing pattern,
conversion to tracer concentrations, motion correction, segmentation of kidney and arterial input
function (AIF), and compartment modelling for estimating the filtration and perfusion. The
reproducibility between repeated MR scans is high, but a comparison to clinical standards for
kidney filtration reveals that the MR estimates for filtration are still not within the range for active
clinical use. In this presentation I will address the challenges related to the processing pipeline.
Additional material:
Flyer
|
 VCF seminars in
2017,
2016,
2015,
2014,
2013,
2012,
2011
|
|

