|
|
||
| You are here: Department of Informatics > Visualization Group > Teaching > INF219: Project in Visualization > Spring 2010 > Morten Bendiksen | ||||||||||||||||||||||||||||||
|
Johannes Kehrer: Integration of Clustering into SimVis Abstract
In this project, two extensions for clustering have been incorporated into the SimVis framework for interactive visual analysis. First, a density-based clustering algorithm (DBSCAN) has been implemented, which can identify arbitrarily shaped clusters and has O(N log N) complexity [1, 2]. Second, the resulting clusters are visualized in a scatterplot matrix, where each plot highlights one cluster in a focus+context visualization. The clustering algorithms has two parameters, a radius (r) and a minimum number of points (minPts) in order to be considered as a dense region [1]. Starting from an arbitrary data point, the neighbors that are located within the radius are queried using an optimized search structure such as a KD-tree. If the number of neighboring points exceeds minPts, the region is considered sufficiently dense, and the points are used as seeds for growing the cluster. Points located in non-dense regions are classified as noise. For performing fast approximate nearest neighbor searches, the FLANN lib is used, which provides appropriate data structures such as a single kd-tree (for low-dimensional data), randomized kd-trees, or a hierarchical k-means tree [3]. Since the nearest neighbor queries represent the most time consuming step in the clustering algorithm, these queries are performed in parallel [4]. As a result, the overall time for clustering could be improved by approximately three times (using a CPU with four cores). A single timestep with about 30.000 data points (and 3 dimensions) can thus be clustered within 2–5 seconds. For finding appropriate settings for the radius and minPts, heuristics proposed in the original paper were used [1]. Before clustering, each data variate is normalized by centering the values around the corresponding mean value and normalizing by the corresponding standard deviation (this is called z-standardization). In order to track clusters over time, our algorithm keeps history of the clusters identified in previous timesteps and tries to match them with the clusters in the current one. The matching is based on the cluster's center and the number of points. If a cluster can not be identified for several timesteps, it is removed from the list of tracked clusters. For representing the resulting clusters, a visualization similar to a scatterplot matrix is used, where each plot highlights one cluster. Additionally, brushing information is encoded using a four-level focus+context style [5]. In the visualization below, the current cluster is depicted in red, cluster 4 has been selected in a histogram (not shown), and the corresponding points are highlighted in green; the data selected only in the current view are shown in yellow. In the utilized importance-driven color coding, the current cluster (shown red) covers green (data selected in another view), and both obliterate yellow (data only locally selected). In our framework, the clusters can be explored using brushing in multiple linked views, including the new cluster view. Screenshots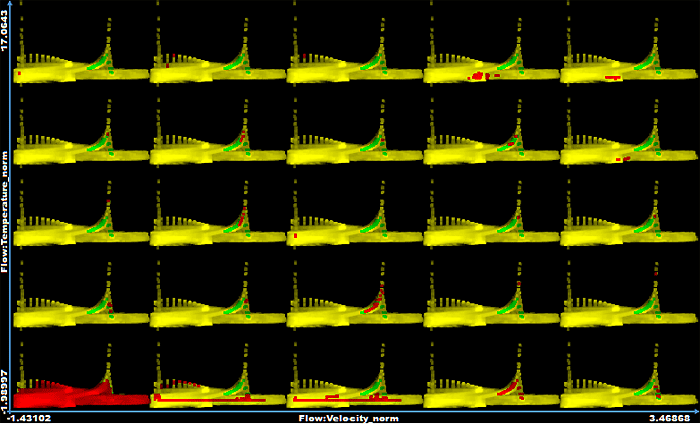
References[1] M. Ester, H-P Kriegel, J. Sander, and X. Xu: "A density-based algorithm for discovering clusters in large spatial databases with noise," in Proc. International Conference on Knowledge Discovery and Data Mining (KDD-96), pp. 226–231, 1996.[2] R. Xu and D. Wunsch II: "Survey of Clustering Algorithms," IEEE Trans. Neural Networks, 16(3), pp. 645-678, 2005. [3] M. Muja and D. Lowe: "Fast Approximate Nearest Neighbors with Automatic Algorithm Configuration," in International Conference on Computer Vision Theory and Applications (VISAPP'09), 2009. [4] D. Arlia and M. Coppola: "Experiments in Parallel Clustering with DBSCAN," in Proc. International Euro-Par Conference Manchester on Parallel Processing (Euro-Par '01), pp. 326-331, 2001. [5] P. Muigg, J. Kehrer, S. Oeltze, H. Piringer, H. Doleisch, B. Preim, and H. Hauser: "A Four-level Focus+Context Approach to Interactive Visual Analysis of Temporal Features in Large Scientific Data," Computer Graphics Forum, 27(3), pp. 775-782, 2008. |
|||||||||||||||||||||||||||||