Advanced Storytelling for Volume Visualization
Master Degree Thesis
by Andreas Lie (andreas.eknes.lie gmail.com)
supervised by Helwig Hauser


Abstract
Over the years, Storytelling has proven to be a very effective way of both retaining and transferring knowledge between humans. We find stories compelling, intriguing and stimulating, and these traits make storytelling as versatile as it is. Storytelling has manifested itself in oral and visual form, both proven useful in their way.
Today researchers struggle with presenting their results from the vast amounts of data collected, often because of the complex visualizations created, and the implicit difficulty of presenting these visualizations to both non-professionals and indeed professionals as well. In this thesis we show that the art of storytelling can aid in presenting complex visualizations, and that stories can be presented in a way that is both comprehensible and credible to the audience.
Storytelling as a form of communicating can help bridging the communication gap in a variety of situations. We aim at improving daily medical communication, exemplified by doctor to doctor communication, doctor to patient communication and medical documentation. Our visualization stories can also be used in an asynchronous form, as a collaboration tool between multiple participants. This can be achieved by exporting the stories and its structure, accompanied with the original data. Any partners can then recreate the stories, edit them and continue this refinement process of collaboration.
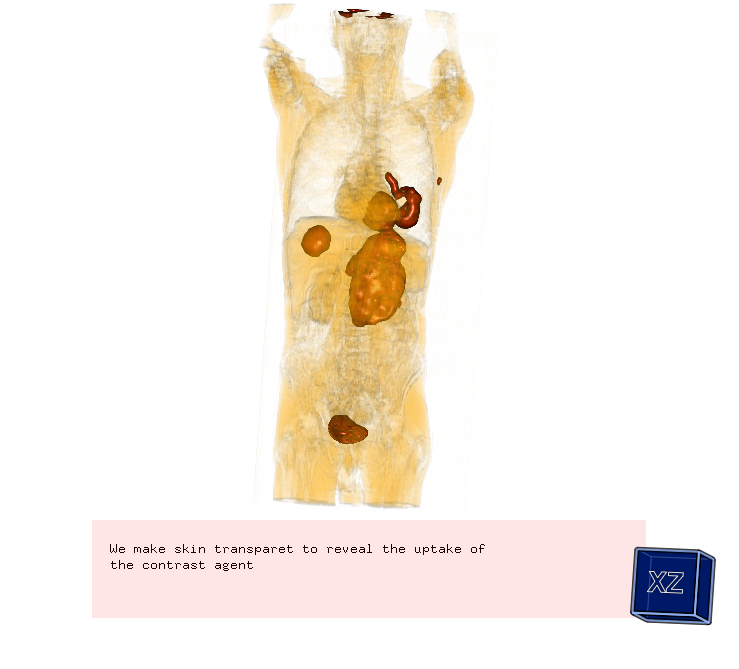
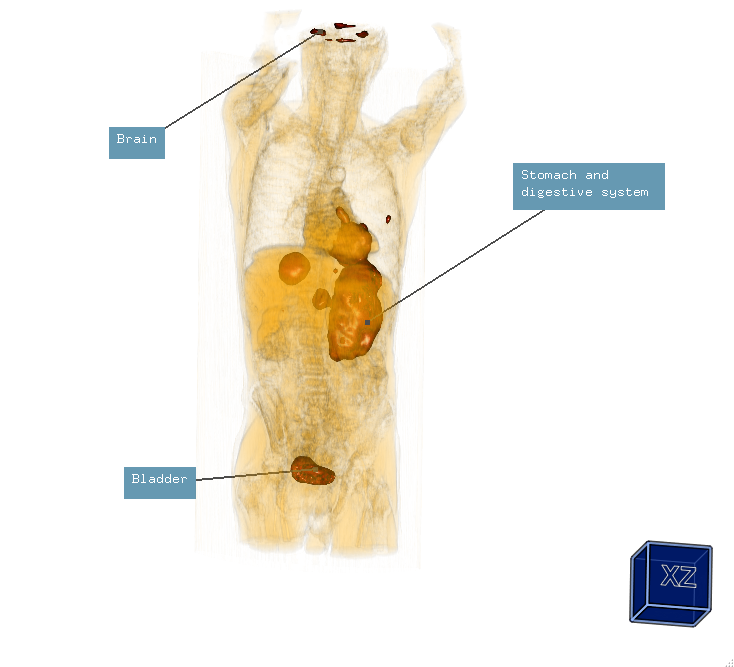
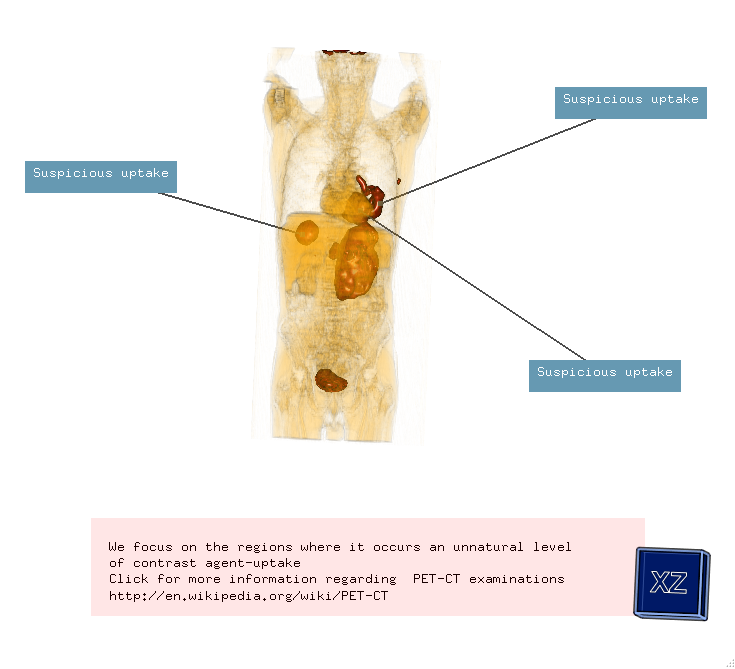
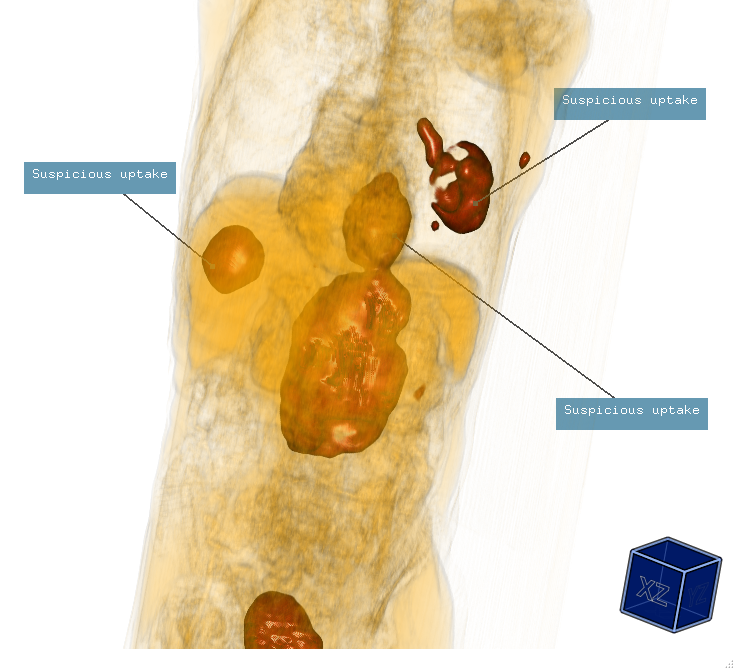
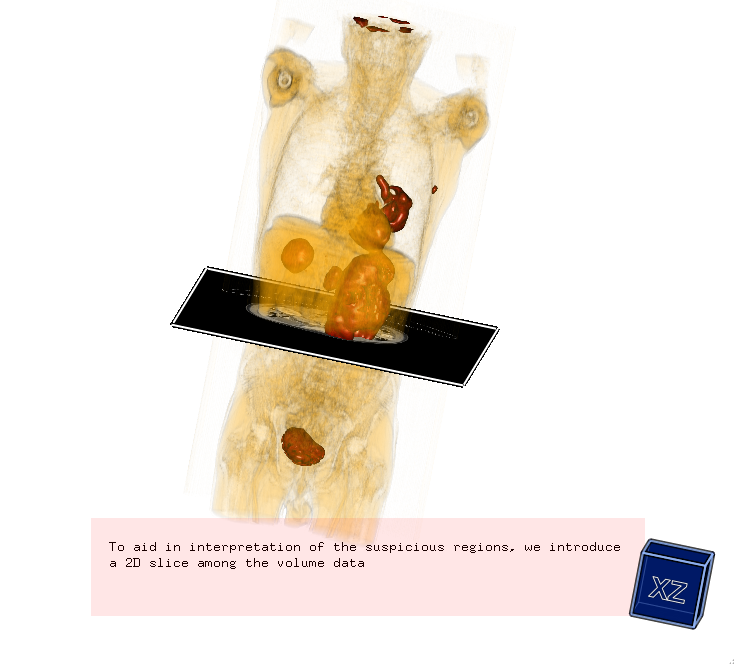
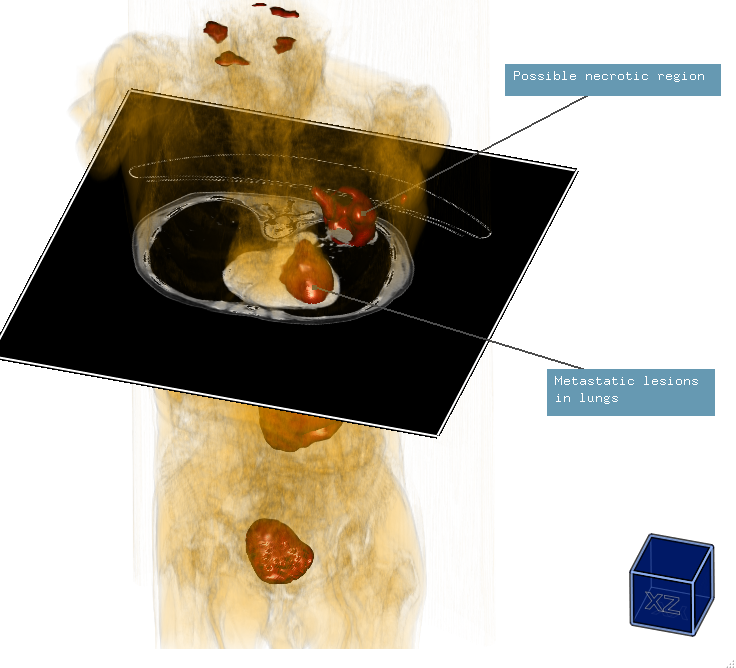
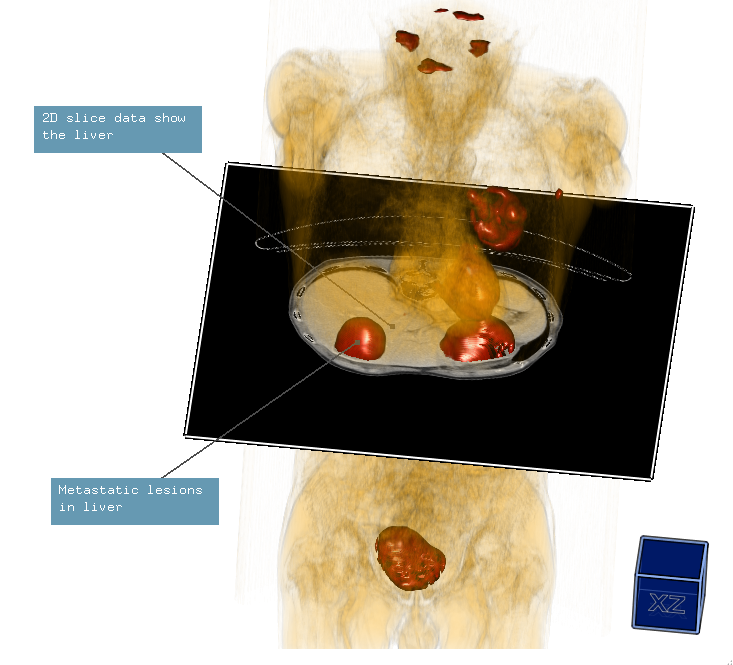
Our solution allows the creation of advanced visualization stories, that support recording, editing and playback at different levels of interactivity. The stories also include textual labels, annotations and recorded oral comments to aid the audience in interpreting the visualization results.
Images