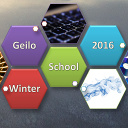
Visualization is an integral part of science, and a necessity for our understanding of complex processes and data. The word visualization can have a broad interpretation, including creating trivial plots of values, advanced rendering techniques, and complex statistical data reasoning. This winter school will target the process of understanding data through scientific visualization, and focus on extracting knowledge from data. With hands-on exercises you will during the course of this winter school learn techniques, tools, and best practices for extracting knowledge from data.
Contact Helwig.HauserUiB.no in case of interest and/or questions.
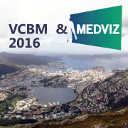
In Sept. 2016, the annual MedViz conference and the Eurographics Workshop on Visual Computing for Biology and Medicine (EG VCBM) are coming together and form a joint, interdisciplinary meeting of experts from technology, medicine, biology, and related fields.
Contact Helwig.HauserUiB.no in case of interest and/or questions.
The rapid growth in volume, complexity, and diversity of biological data represents an increasing challenge for researchers in many areas. The aim of this workshop is to bring together experts from biology, bioinformatics, and visualization to develop a joint understanding of the key technologies, obstacles, and opportunities involved in in generating insight from these large and highly complex data sets.
Contact Stefan.BrucknerUiB.no in case of interest and/or questions.
EuroVis 2011 is the 13th annual Visualization Symposium jointly organized by the Eurographics Working Group on Data Visualization and the IEEE Visualization and Graphics Technical Committee.
We are excited about the big honor to organize this prestigeous event in Bergen in 2011.
We have started to organize the conference and are also preparing the event's public relations including flyers, posters, web pages, etc.
Contact Helwig.HauserUiB.no or Ivan.ViolaUiB.no
in case of interest and/or questions.
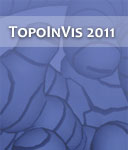
TopoInVis 2011 in Zurich, Switzerland, will follow the three successful workshops
in 2005
(Budmerice, Slovakia), 2007 (Leipzig, Germany)
and 2009 (Salt Lake City, USA). It will be
held in an open atmosphere of informal discussions, open exchange and
personal interaction. Submissions are peer-reviewed before the
workshop. All accepted papers must be presented at the workshop.
Contact Helwig.HauserUiB.no
in case of interest and/or questions.
The Research Days (Forskningsdagene) held in Bergen are an annual festival dedicated to research. During this event research and learning institutions of Bergen presented their activities to a broad audience including children and adults, laymen and experts.
This year, the VisGroup together with their partners from HUS and CMR presented the newly started Illustrated Ultrasound (IllustraSound) project.
Contact Ivan.ViolaUiB.no
in case of interest and/or questions.
Twelve invited talks and a panel discussion form the program of IllustraVis09.
The event is held in the Vilvite Center, on 3rd and 4th of June 2009. Our intention is to host a discussion
arena for experts and interested audience from different disciplines that play important role in application
of illustrative visualization in science.
Contact Ivan.ViolaUiB.no
in case of interest and/or questions.
Six interesting invited talks (three from Bergen, three from abroad)
form the program of ClimaVis08 in the afternoon or 21st of August (13h--17h30),
which is an event where visualization researchers meet scientists
from meteorology and climate research to exchange about the role of
visualization in that fascinating field of research.
Contact Helwig.HauserUiB.no
in case of interest and/or questions.
The traditional conference SimVis in Magdeburg, Germany,
has a special focus on flow simulation and visualization in 2008.
Contact paper co-chair Helwig.HauserUiB.no
in case of questions.
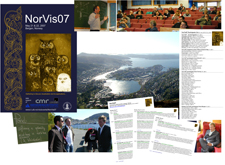
On May 21st & 22nd, 2007, about 60 participants
from Bergen, Norway, and from abroad met in Bergen, Norway, to discuss visualization
and its applications. Ten invited talks of selected visualization researchers (six from the
international visualization community) as well as of top domain specialists (four from
selected local fields of potential application of visualization) formed an interesting
program together with a lot of stimulating discussion.

 UiB.no in case of interest and/or questions.


 by Harald Kryvi")